Maritime Monitoring
Boat Detection
DETECTION AND SURVEILLANCE
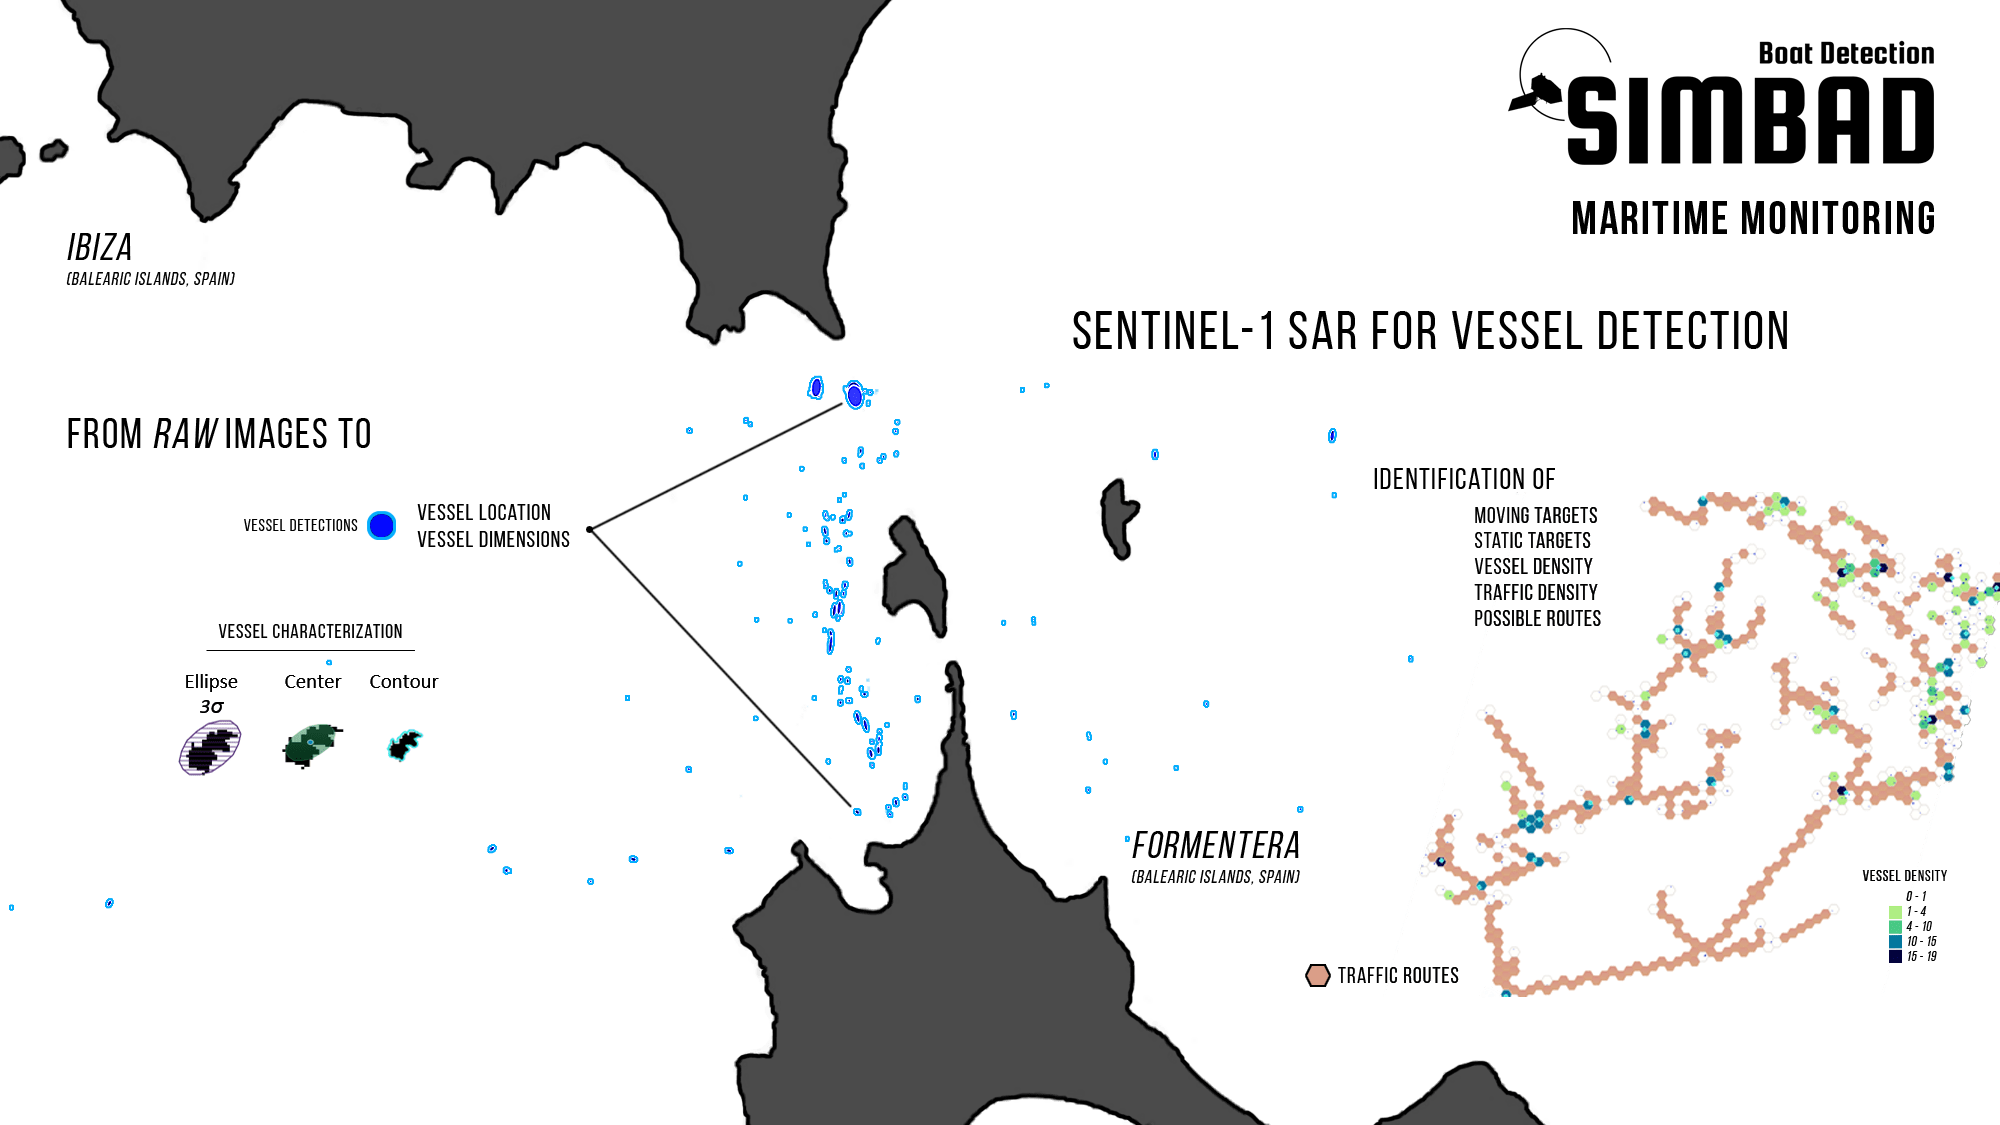
Sentinel-1 provides global, regular and repeated coverage of coastal and open sea waters. With its Synthetic Aperture Radar (SAR), Sentinel-1 has the advantage of operating under cloud cover or a lack of illumination and can acquire data over a site during day or night time under all weather conditions. One of the many applications of Sentinel-1 SAR data is for Maritime Monitoring, making it suitable for vessel detection.
By monitoring ship behavior, it is possible to alert of potential illegal activities, like border crossings, infringements of maritime traffic separation schemes, and illegal fishing. Maritime surveillance is also useful to assess the use and management of the maritime space.
Sentinel-1 routinely collects large amounts of images which are made freely available. The vast amounts of data produced by the constellation of satellites are a great opportunity to develop systems for Maritime Monitoring. To become fully operational, these processing systems must be entirely automatic with a controlled level of reliability and robustness.
See PDF

SENTINEL-1

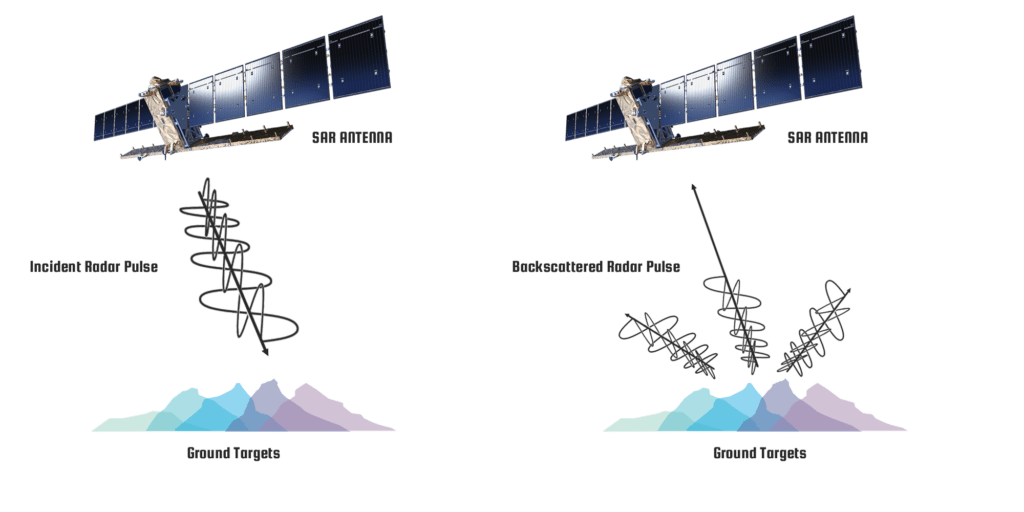
The system developed by Quasar provides a fully automatic ship detection algorithm for Sentinel-1 SAR images, providing a long-term, wide-area monitoring of vessel traffic along with vessel location and size estimators and classification. Automatic vessel detection, without human intervention, requires reliable results in order to remove false alarms which are not due to vessels.
The behavior of the vessel detection pipeline developed by Quasar, in terms of success rate as a function of boat size, is summarized in the following table:
| Vessel Detection Processing Pipeline Summary | ||
| Vessel size > 10m | Vessel size > 20m | Vessel size > 30m |
Precision: 0.55 Recall: 0.5625 Accuracy: 0.68 FSscore: 0.56 | Precision: 0.61 Recall: 0.8055 Accuracy: 0.74 FSscore: 0.69 | Precision: 0.75 Recall: 0.9167 Accuracy: 0.86 FSscore: 0.83 |
(1) The Precision tells us to what percentage one is sure that what is being detected is a vessel or not. (2) The recall tells us what percentage of all ships are being detected in a given scene. (3) Accuracy and FScore are two ways of combining Precision and Reall. Either one of these two values can be used as a value to estimate the success rate.
| ||
As an example, from the table above, for boats larger than 30 meters in length, the success rate is more than 80%, a fairly good value according to other studies.
It is important to notice that these numbers depend on many factors. Amongst them, it depends largely on the analysis window size chosen, the type of pre-processing, the probability of false alarms, the type of image, whether the area is prone to have a lot of noise, such as areas near permanent radars, the minimum size of vessels of interest to be detected, etc…
These factors should be taken into consideration since the detection capabilities of the vessel processing pipeline depends largely on the problem at hand. For example, weight can be given to detecting the maximum number of vessels in a given scene versus how reliable each single detection is. Or the opposite, fewer vessel detections in favor of a higher reliability for single detections.
Products | Applications | Services
Maritime Monitoring Products
- Sentinel-1 SAR Processed Image
- Vessel Detection Shapefile
- Vessel location and size estimators
- Oil Spill Detection Shapefile
- Characterization of Oil Spills
Maritime Monitoring Applications
The Maritime Monitoring Products can be used for different applications. Some examples are:
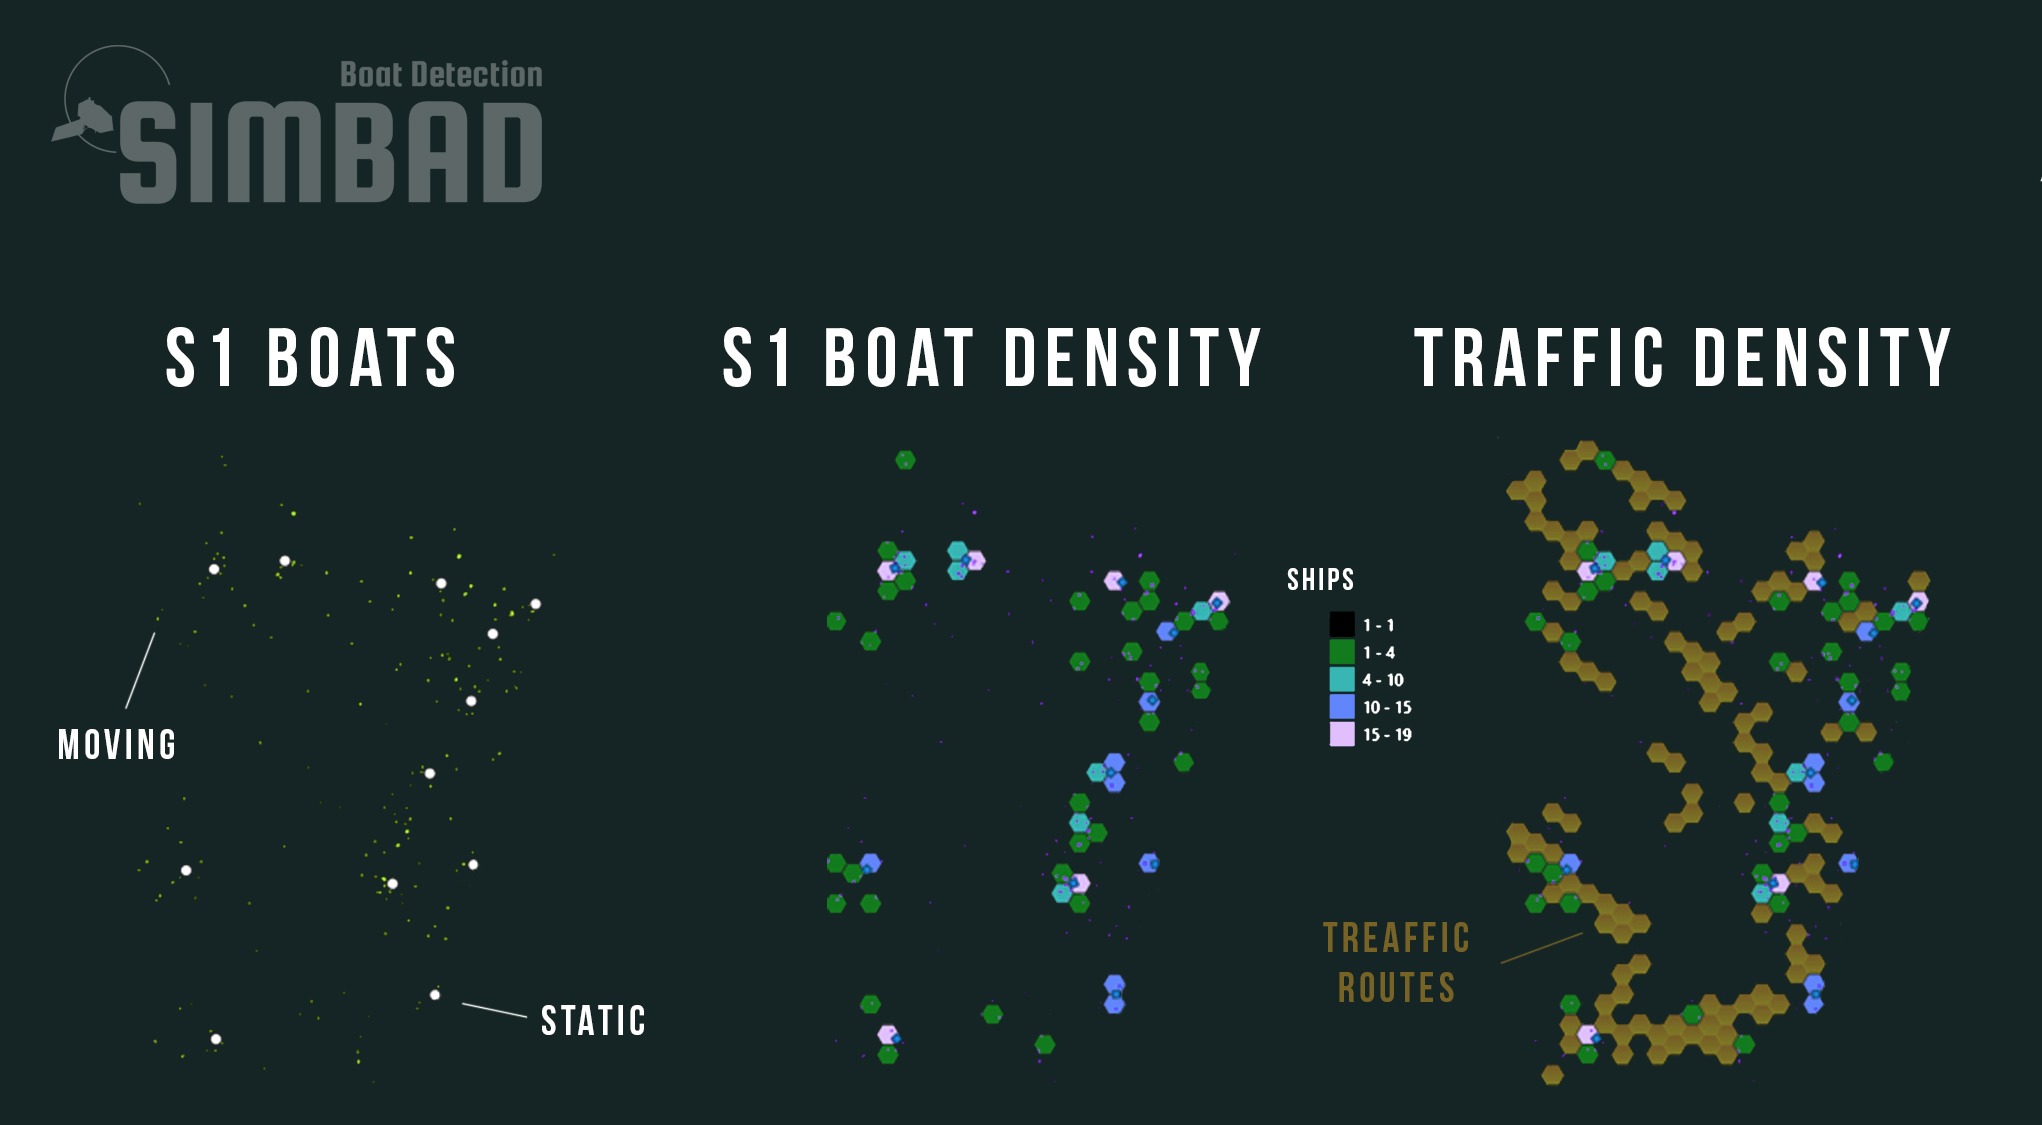
- Vessel and vessel traffic spatial density and distribution
- Derivation of most likely vessel routes
- Identification of static and mobile maritime objects
- Hotspot identification and their temporal and spatial evolution
- Autocorrelation analysis to characterize the behavior of different spatial zones
- Temporal analysis for the extraction of trends on different time scales
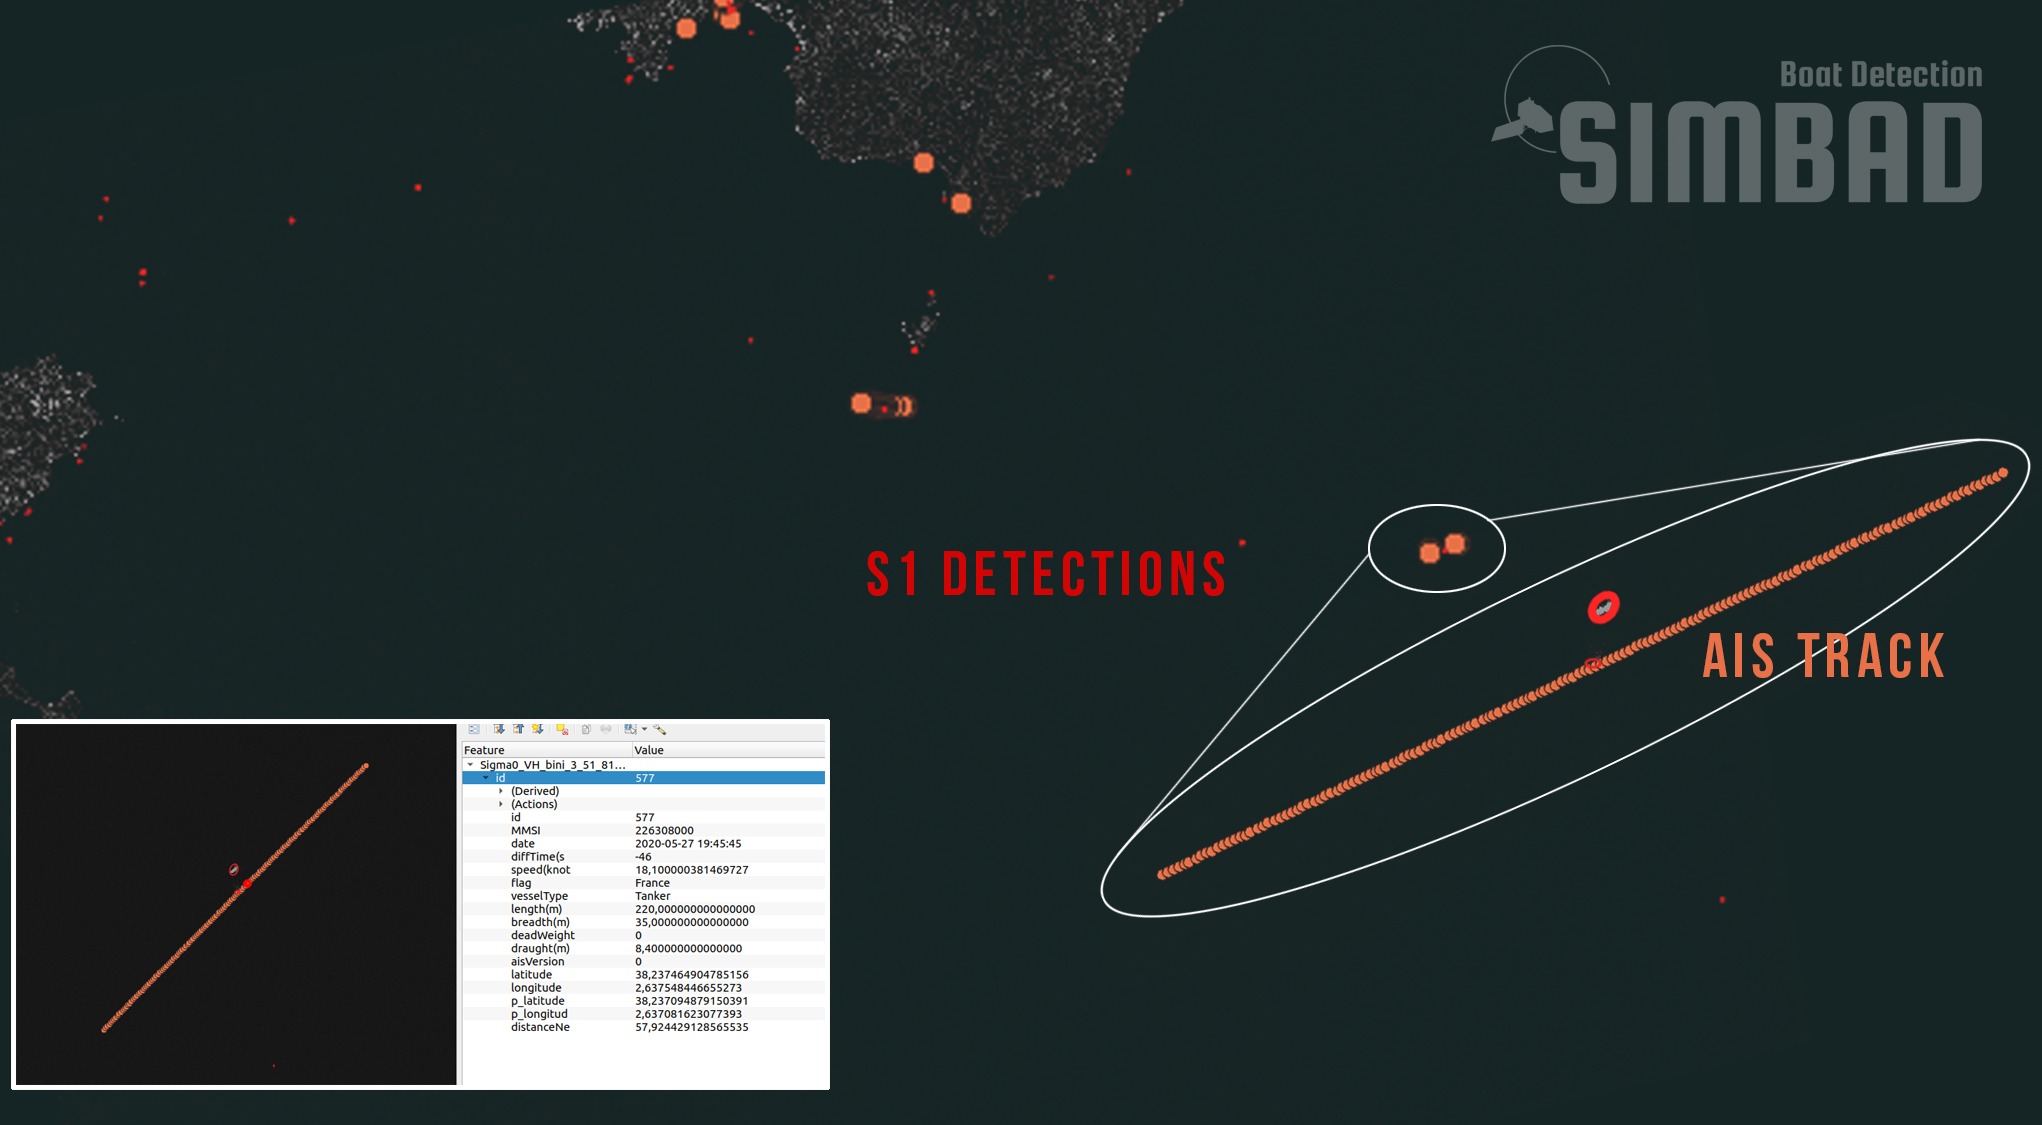
- Cross-correlation with AIS or other external sources of data
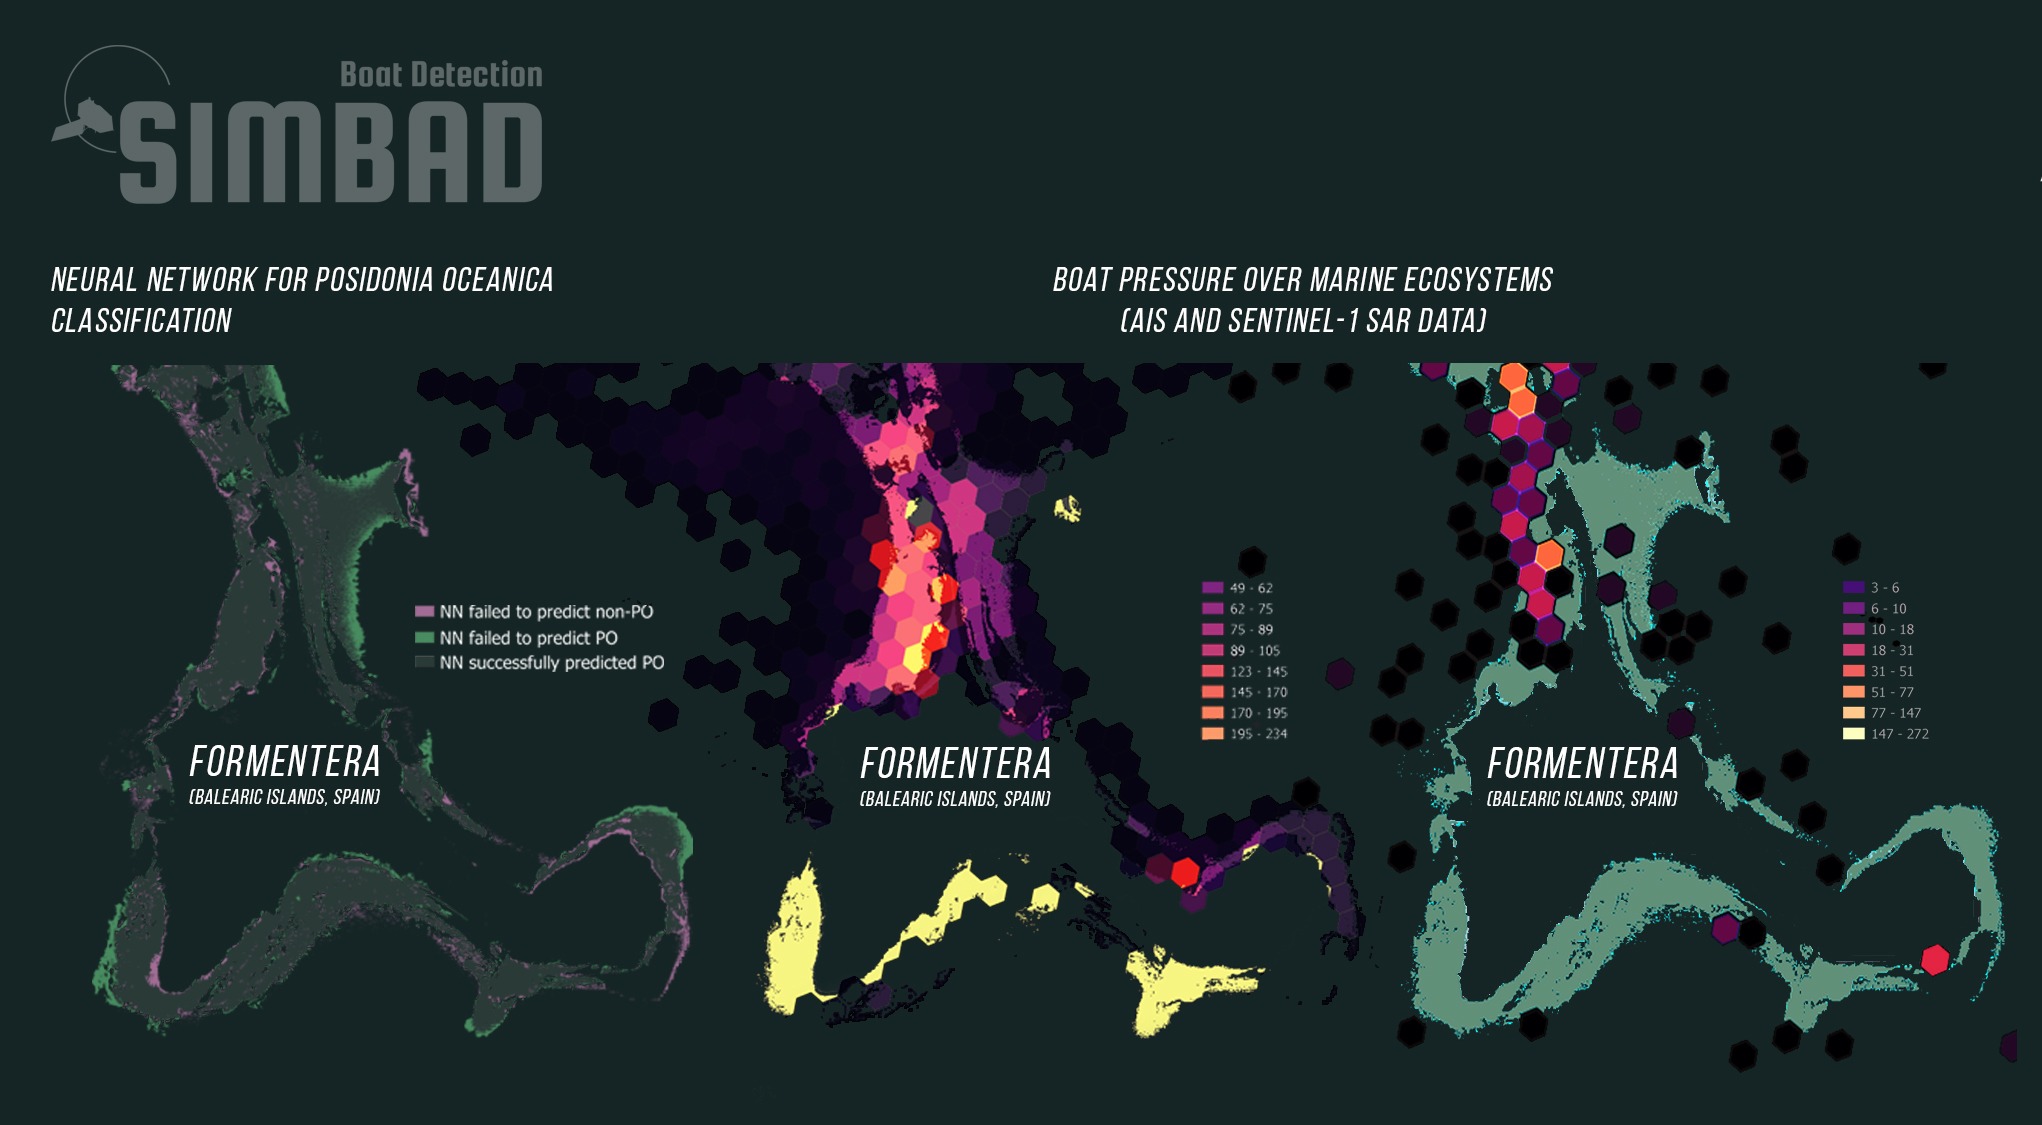
- Cross-correlation with location of Marine Ecosystems
- Follow the route of single large vessels over time (cruises, tankers, …)
(*) Non time continuous coverage. Dependent on revisit time.
Maritime Monitoring Services
- Dedicated tailor-made solutions for Sentinel-1 SAR applications
- Consulting services about Sentinel-1 data, products and applications
- Support the integration of Sentinel-1 data into your solution
- Support the integration of auxiliary non-EO data into your EO solution
- Participation in R&D projects at national and European levels with experience leading projects and working within large collaborations


