Woodlands

Forest Health

MAPPING AND MONITORING WOODLAND AREAS

Sentinel-2 (MSI) provides global, regular and repeated coverage of inland, coastal and open sea waters under cloud-free sky. One of the many applications of Sentinel-2 data is for the monitoring of Woodland areas.

Woodland ecosystems underpin everything from Spain’s rural economies to Europe’s climate goals: they lock up vast carbon stocks, buffer floods, shelter biodiversity and feed local supply chains—yet they are increasingly strained by pests, drought and illegal logging. Because manual surveys struggle to keep pace, the open-access Copernicus Sentinel fleet has become a game-changer for forest guardians. Optical Sentinel-2 images (10–20 m) can be stacked every five days to flag subtle canopy changes; giving managers an early-warning layer they never had before. Radar-based Sentinel-1 cuts through clouds to deliver weekly “RADD” alerts of selective logging or road building, while its dense time-series feed Europe’s biomass maps that quantify how much carbon each hectare of forest is storing. In combination, Sentinel-1 and -2 can pinpoint clear-cuts down to half a hectare, classify forest types and reveal disturbance fronts, providing the evidence base that policymakers need to enforce Spain’s pest-control, wildfire-risk and timber-legality regulations.

S2 and S1 routinely collects large amounts of images which are made freely available. The vast amounts of data produced by the constellation of satellites are a great opportunity to develop systems for marine ecosystem monitoring in shallow coastal waters. To become fully operational, these processing systems must be entirely automatic with a controlled level of reliability and robustness.

Pine Processionary: The pine processionary is as much a public-health issue as it is a forestry pest.

In Spain, about 5.7 million ha of Spanish conifer forest lie within the moth’s climatic envelope; in 2025 authorities treated ≈65 000 ha of pine stands in the Community of Madrid, while Murcia reported 8 000 ha of active defoliation.

Seasonal “parades” run late winter → early spring – the caterpillars overwinter in silken tents and march down the trunks roughly February-April, with most mass descents recorded around March–early April.

Each larva packs ~500 000 stinging hairs – third-instar caterpillars are covered in urticating setae loaded with the allergen thaumetopoein, able to trigger rashes, conjunctivitis or even anaphylaxis in people and other mammals without direct contact.

Climate change is pushing the front – Warmer winters over the past three decades have let colonies survive beyond their historic Mediterranean stronghold and start earlier in the season. line north and uphill. 


Projects

See PDF

SENTINEL-1

Synthetic Aperture Radar (SAR)
Wave aquisition mode
20 km by 20 km at 5 m spatial resolution

6 day revisit at equator

SENTINEL-2

Multispectral Instrument (MSI)
13 spectral bands: four of them at 10 m spatial resolution

5 day revisit at equator

Quasar’s system provides Posidonia oceanica maps derived from S2 with a 10 m spatial resolution and at different temporal scales, being the recommended one, but not limited to, yearly cartography. A seasonal and yearly scale cartography should be enough for decision-making on conservation measures. Our classification technique is able to recover from S2 images the detailed spatial shape of the seagrass meadows with a correct recall rate of 84% for Posidonia pixels. These results prove accurate up to depths close to 30 meters in depth. Our classification method can provide an extremely cost-effective way to monitor variations of Posidonia oceanica meadows using the S2 archive (2015-present). Another advantage of the system designed is the ability to replicate results.

Products | Applications | Services

Marine Ecosystems Products
  • Posidonia oceanica maps (shapefiles) at a 10 m spatial resolution
  • Posidonia oceanica maps (shapefiles) at different temporal scales, like yearly or seasonal
Marine Ecosystems Applications

The Marine Ecosystems Products can be used for different applications. Some examples are:

  • Time-series analysis of Posidonia oceanica cartography for the provision of evidence to support the development of better coastal laws and regulations addressing identified issues
  • Allow for spatial and temporal evolution studies to monitor degradation as a result of natural causes or coastal development
  • Evaluation of ecosystem status by comparing the before and after natural events or coastal human activity, like infrastructure development
  • Determine the spatial extent covered by marine ecosystem over a range of depths (down not more than 30 meters)
  • Distinguish different seagrass species, in the Mediterranean Sea, mainly Posidonia oceanica and Cymodocea nodosa
  • Cross-correlation of marine ecosystems with maritime activities (vessel traffic, tourism, fishing, etc …), like, the location of maritime objects extracted from Sentinel-1 SAR data or external sources of data (ex. AIS data)
Marine Ecosystems Services
  • Dedicated tailor-made solutions for satellite and model-based Marine Ecosystems applications
  • Participation in R&D projects at national and European levels
  • Consulting services about Sentinel-2 and applications
  • Support the integration of Sentinel-2 data into your solution
  • Support the integration of Copernicus Marine Service products into your solution

Maritime Ecosystems | Application Examples

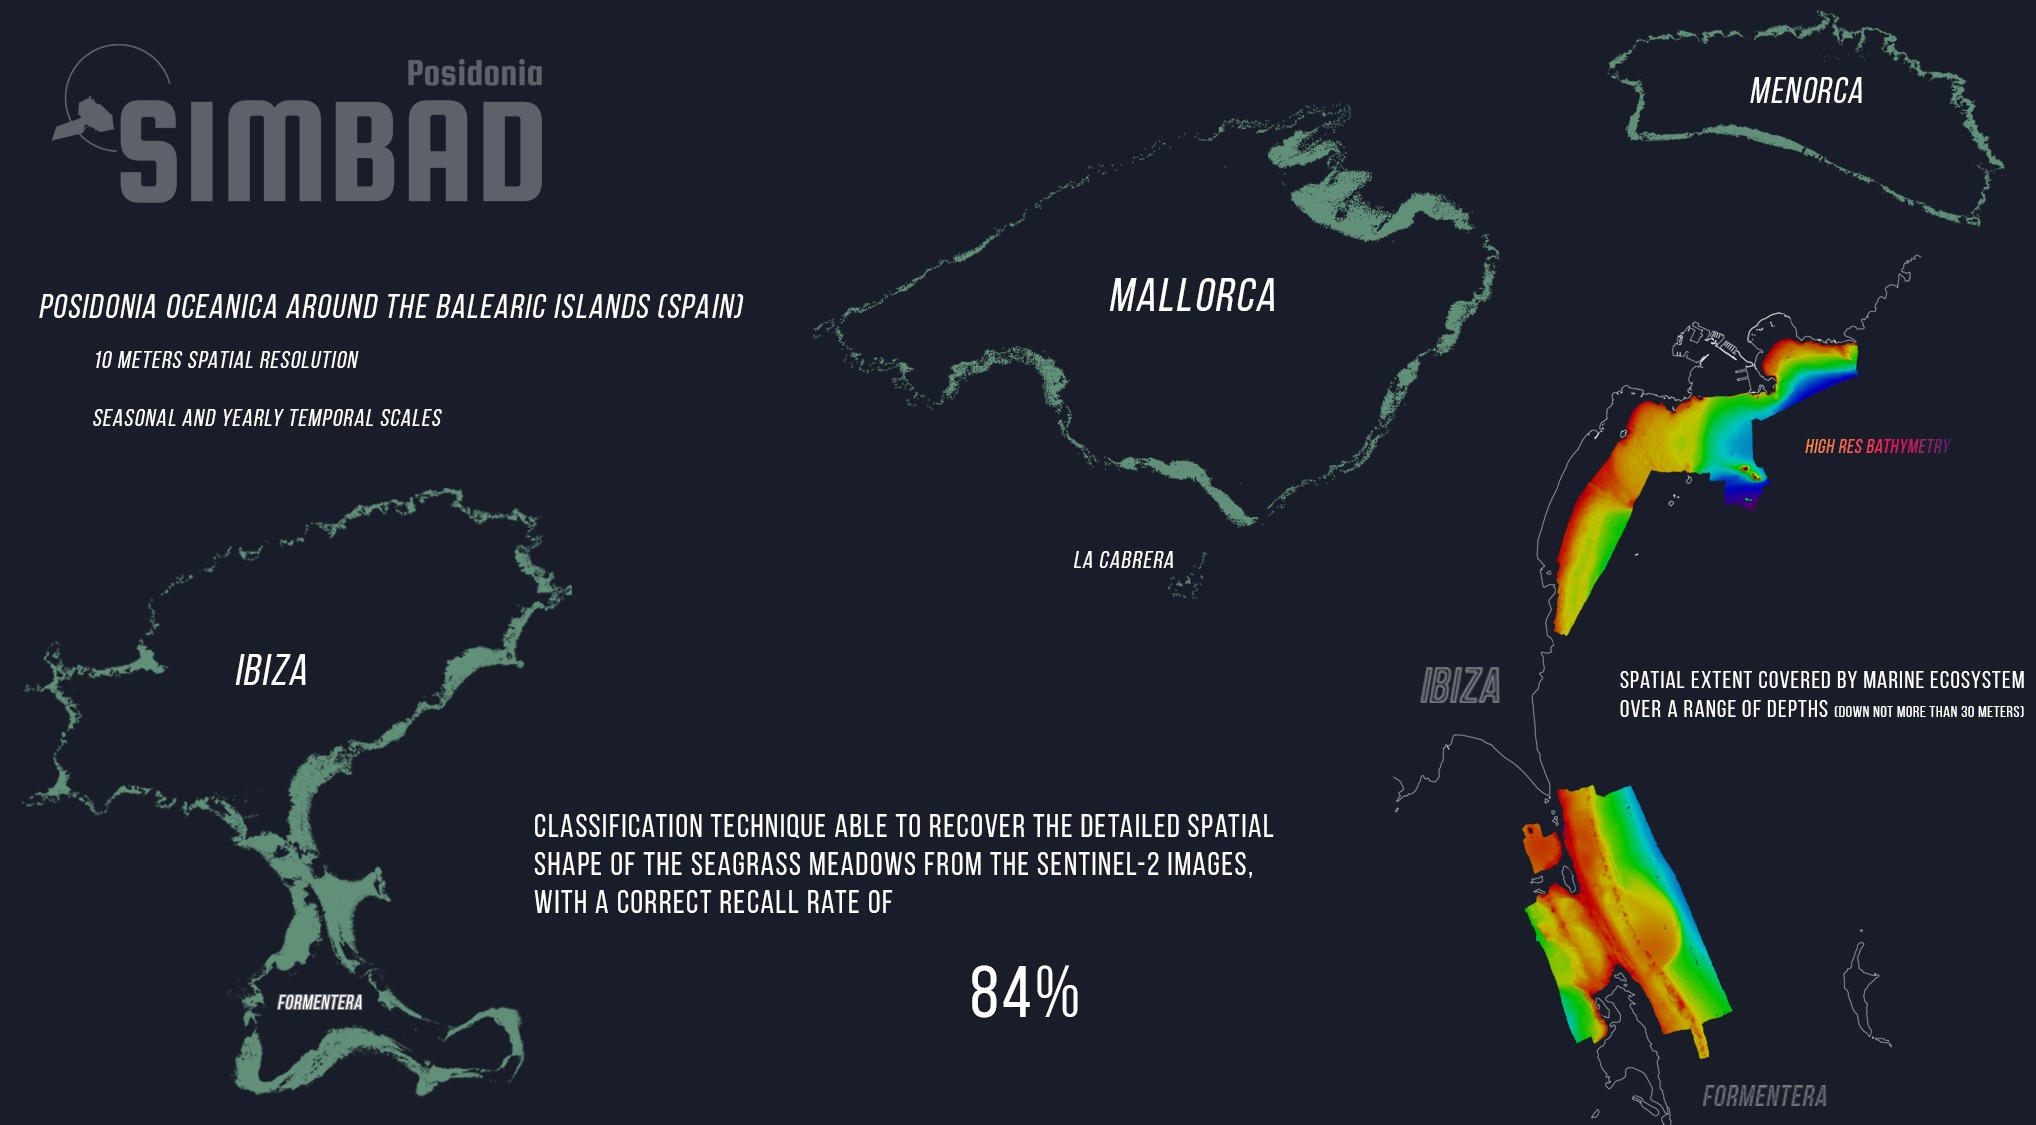
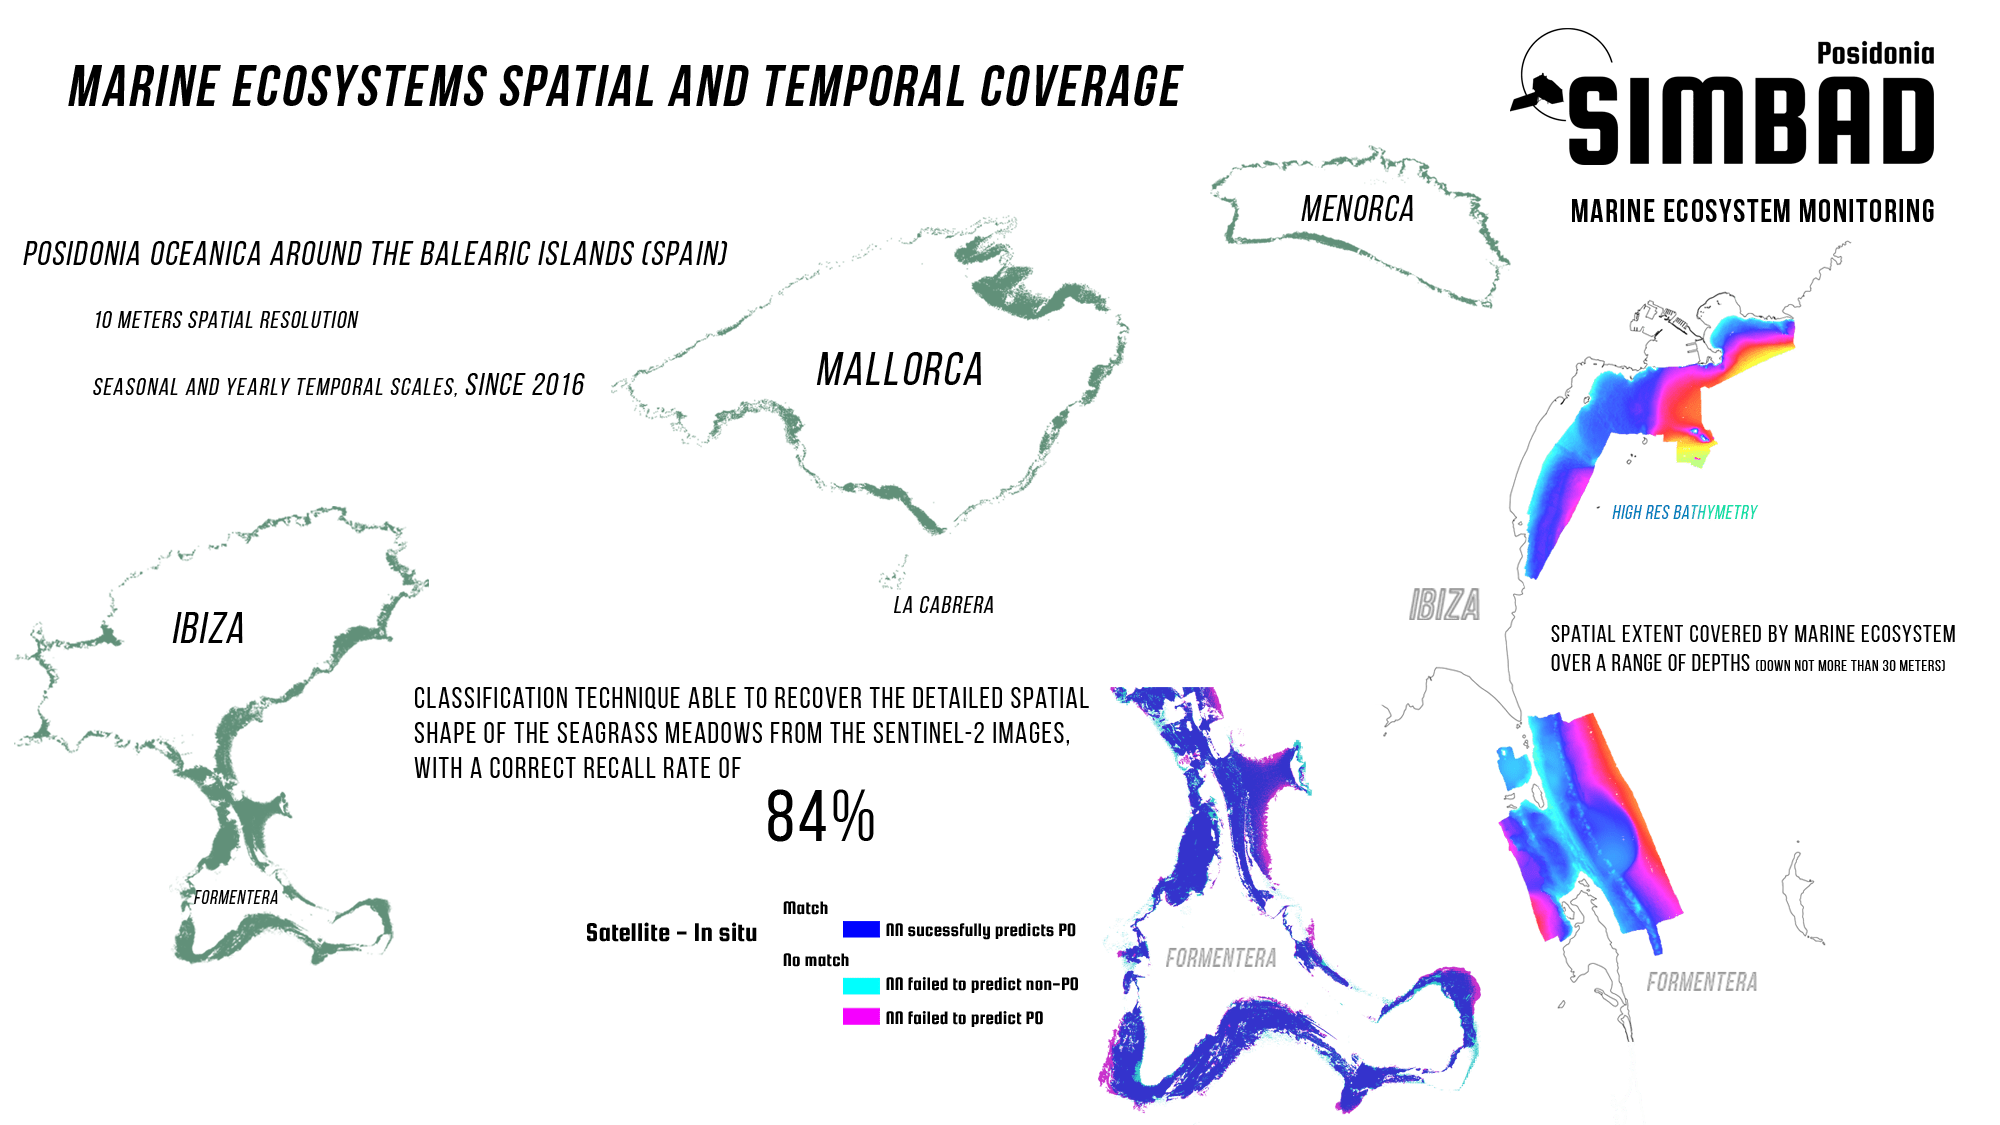
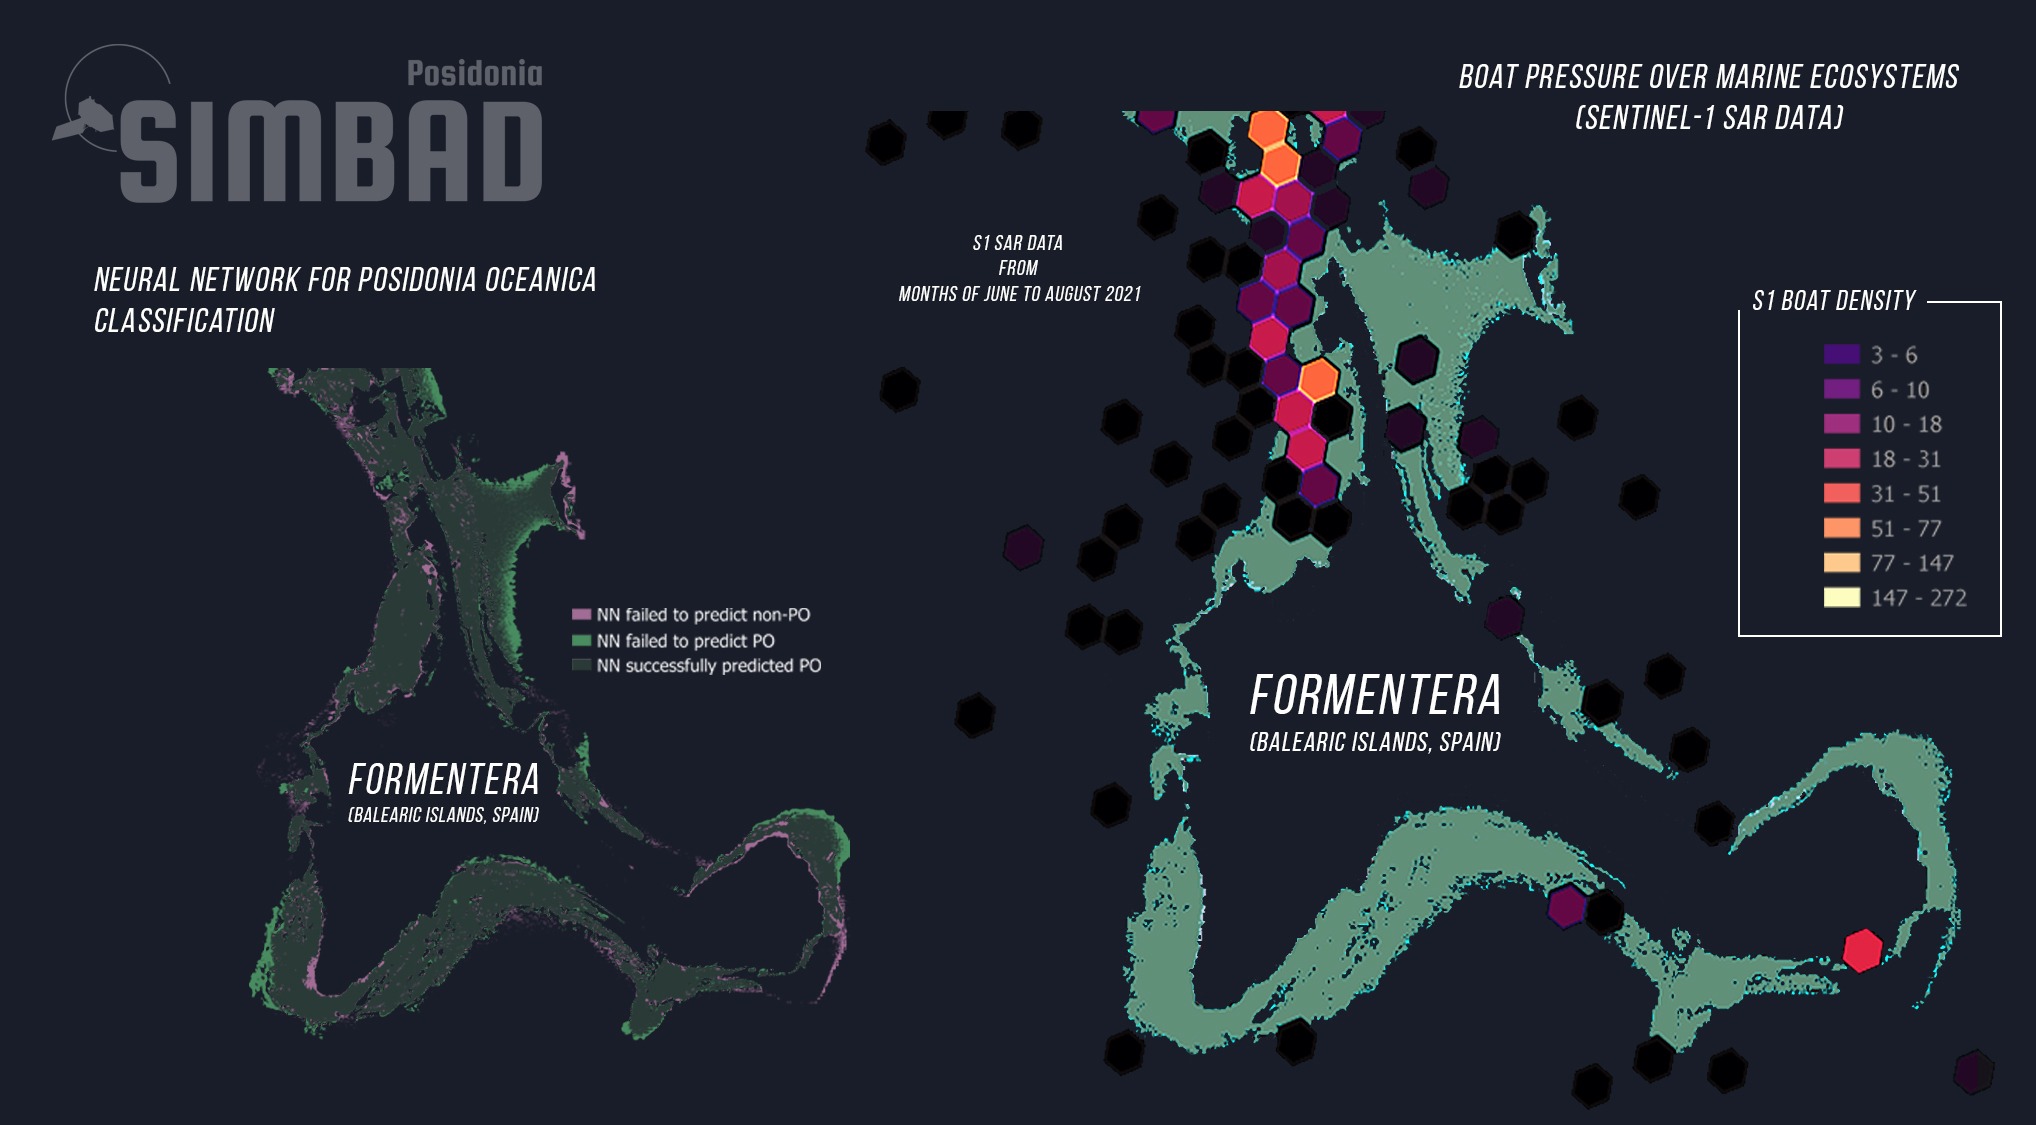
Marine Ecosystems Spatial Coverage

PO cartography allows to estimate the spatial coverage of marine ecosystems and stablish their correlation with maritime activities like, vessel traffic, tourism, fishing, etc... 
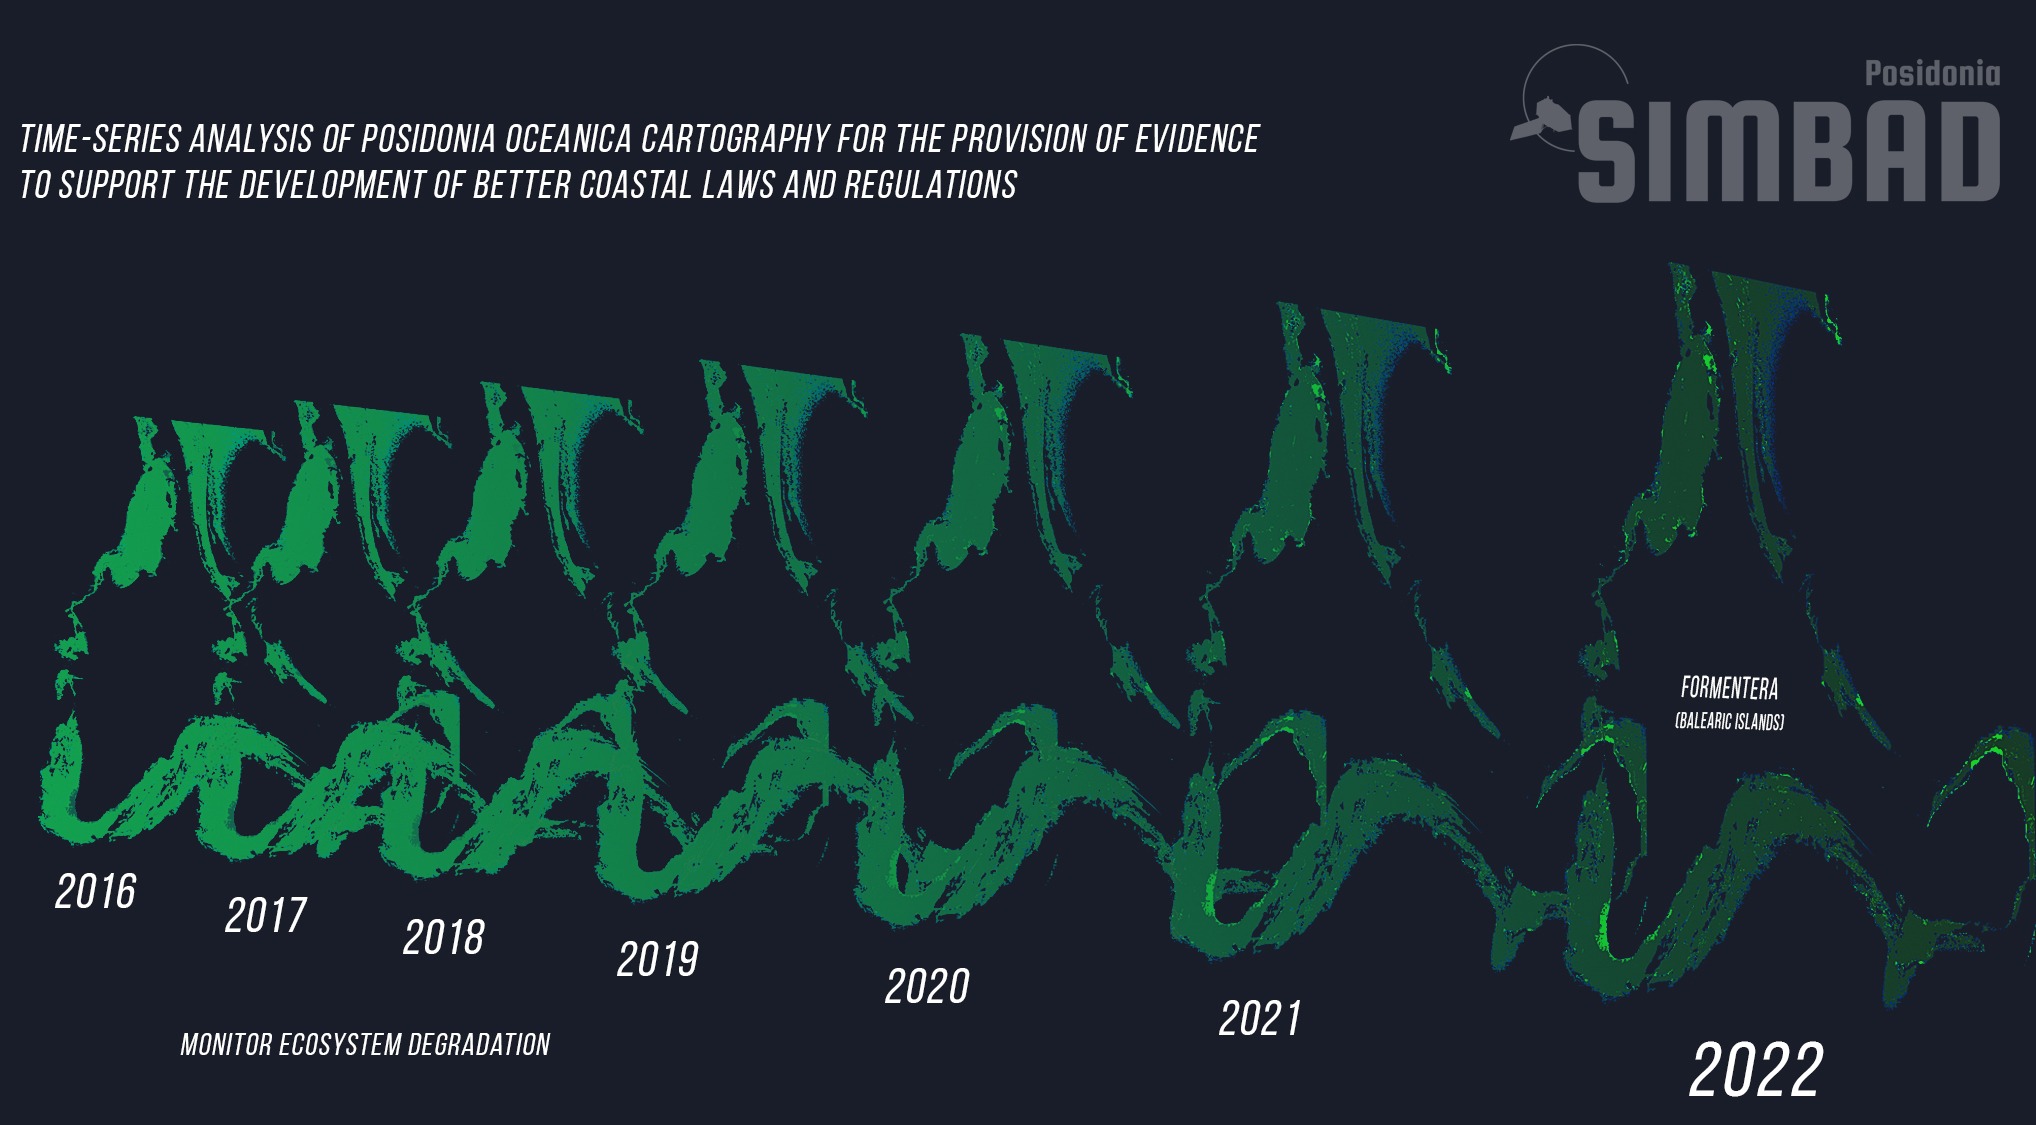
Spatial studies can support the development of better coastal  laws and aid in the decisión making progress on conservation measures.

Marine Ecosystems Temporal Coverage

Temporal evolution studies of marine ecosystems can be used to monitor ecosystem  degradation as a result of natural causes or coastal development. It is possible to evaluate the status of the ecosystem by comparing the before and after natural events or anthropogenic activities.

Boat Presure Over Marine Ecosystems

S1 boat detections can be used in combination with meadow location to assess boat pressure over marine ecosystems. The temporal analysis of these pressure points can be used to monitor seasonal boat activity and help in putting measures in place to protect marine ecosystems.